US housing · Real Estate
September new-home sales fall an estimated 5.3% from a year earlier
Builders cut prices as September sales weaken, while separate August indexes show existing-home values rising 2.4% and 2.1% annually.
By Rian Keswicke · 4 min read
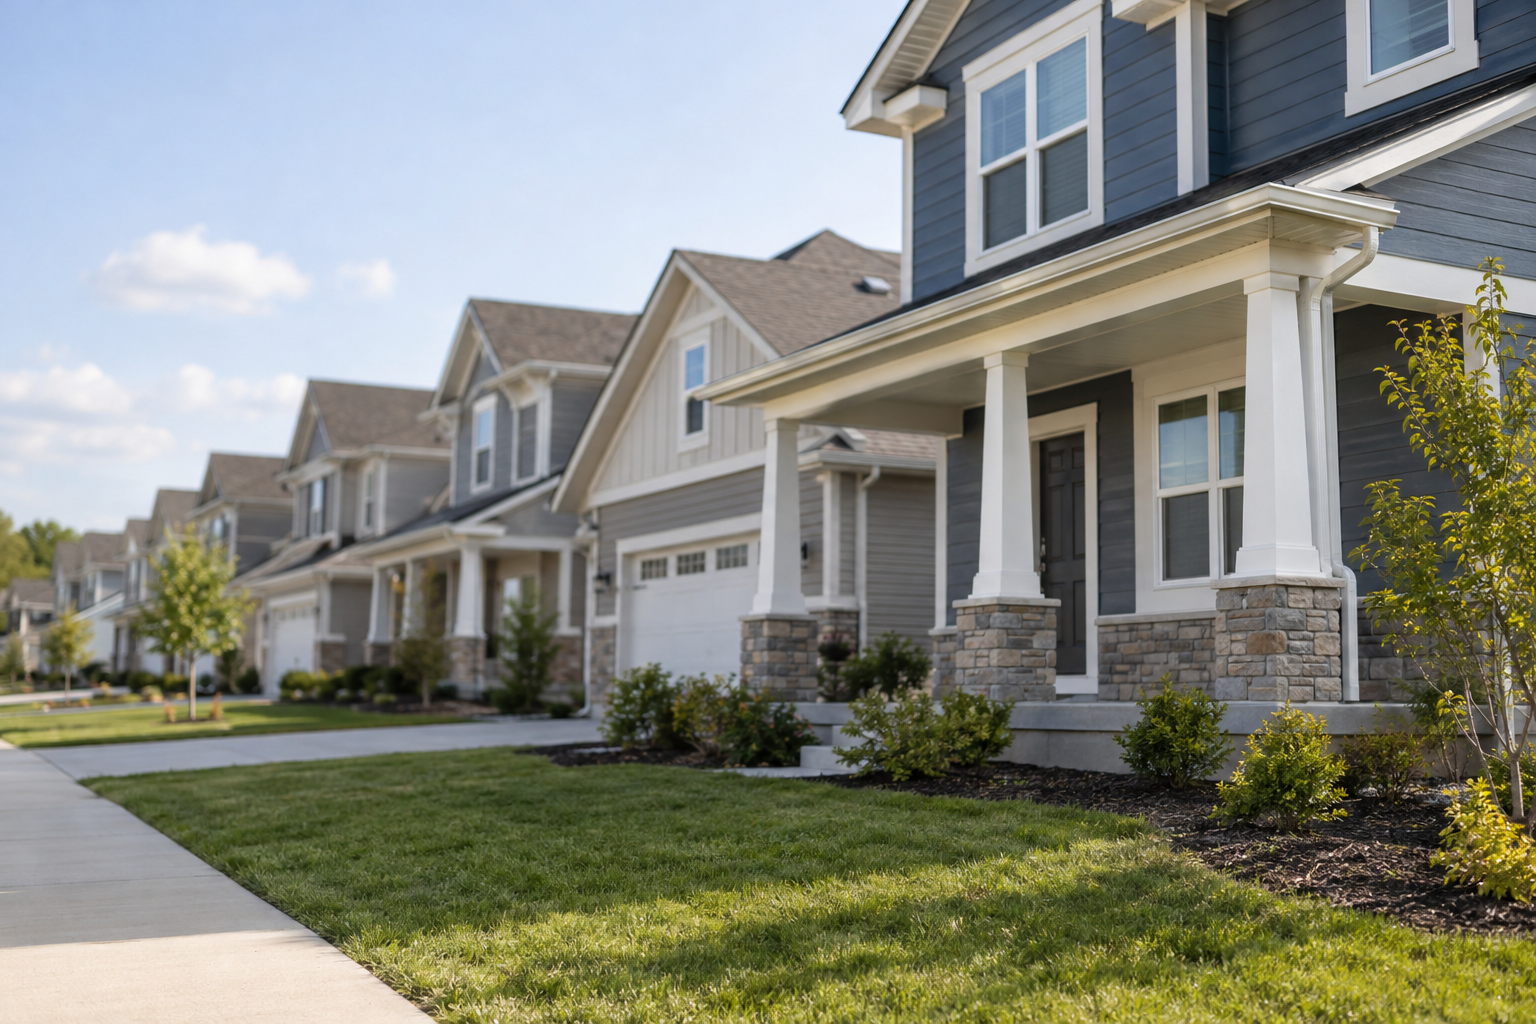
US new-home sales were estimated to have weakened in September as builders lowered prices and offered financing incentives, contrasting with annual gains in existing-home values recorded by separate August indexes. The reports released on October 27 suggest a market in which builders are making concessions to attract buyers even as resale values continue to advance. However, the Census Bureau cautioned that September’s estimated sales declines, both monthly and annual, were not statistically significant, with the survey’s margin of error allowing for no change.
New single-family home sales reached a seasonally adjusted annual rate of 676,000 in September, according to the Census Bureau and the Department of Housing and Urban Development. That was 5.3 percent below a year earlier and 0.6 percent below August’s revised 680,000 rate. The median new-home price dropped 3.9 percent from a year earlier to $400,400, while the average declined 6.7 percent over the same period to $472,800. Separately, the Federal Housing Finance Agency reported a 2.4 percent annual increase in August house prices; the S&P Cotality Case-Shiller national index rose 2.1 percent.
The different reporting periods and measures matter: September’s new-home transactions and prices do not describe the same market segment or month as the August value indexes. Still, the price relationship between new and existing homes has shifted. First American Deputy Chief Economist Odeta Kushi said the median new-home price had remained below the existing-home median for seven consecutive months, departing from the usual premium for new construction. Using National Association of Realtors data, she put September’s difference at $17,100.
Read more: Senior housing investors see upside; occupancy reported above 90%
September sales nevertheless exceeded the 653,000 forecast cited by Kushi, who viewed that result as evidence of resilience despite rising mortgage rates. She attributed support for demand to builders’ ability to adjust prices and provide financing incentives. The broader sales record was weaker: transactions during the first nine months of 2026 were 2.9 percent behind the corresponding period last year. Unlike the estimated sales changes for September, the decline in the average new-home price was statistically significant, according to the Census Bureau.
A shift in the mix of homes sold helps explain the lower prices. Properties costing less than $400,000 accounted for 51 percent of September sales, compared with 46 percent a year earlier. Homes priced at $1 million or more represented 4 percent, down from 6 percent. Kushi said smaller homes contributed to the price decline. The figures therefore reflect more than concessions alone: builders are also bringing lower-priced properties to buyers whose budgets limit what they can purchase.
October’s National Association of Home Builders/Wells Fargo survey showed those concessions becoming widespread. Price reductions were reported by 43 percent of builders, the highest share in the 2020-2026 period, while 65 percent offered sales incentives. Builder confidence slipped to 29, its weakest reading since June 2012. Excluding the pandemic’s onset, buyer traffic was at its lowest since April 2012, according to NAHB. These readings temper the stronger-than-forecast September sales result, indicating that builders were sustaining transactions against a difficult demand backdrop.
Read more: Iran weighs Hormuz leverage as U.S. escalation looms
Inventory offered a mixed picture. Builders had 476,000 homes available at September’s end, down 1 percent from August but equivalent to an 8.4-month supply at the prevailing sales pace. Completed homes available for purchase declined to 111,000 from 122,000 a year earlier, a level Kushi described as this year’s lowest. Meanwhile, homes offered before construction had begun increased to 115,000 from 103,000. Completed properties had been on the market for a median of 3 months after completion, compared with 2.4 months a year earlier.
Existing-home value gains were uneven geographically. FHFA’s index, based on purchase-only data from Fannie Mae and Freddie Mac, increased 0.3 percent between July and August. Annual growth ranged from 0.5 percent in the Mountain division to 4.4 percent in East North Central, which includes Illinois and Ohio. Middle Atlantic prices rose 4.3 percent. Case-Shiller showed a similar concentration of strength: Chicago led its metropolitan indexes for the sixth consecutive month, gaining 6.7 percent annually, followed by New York at 6.2 percent and Cleveland at 4.3 percent.
Case-Shiller’s national annual increase accelerated from 1.9 percent in July, but remained below consumer-price inflation of 3.4 percent. S&P Dow Jones Indices said home values had declined in inflation-adjusted terms for the 15th consecutive month. The national index fell 0.2 percent monthly before seasonal adjustment but gained 0.3 percent after adjustment. Rebecca Kaufman, associate director of commodities at S&P Dow Jones Indices, interpreted that contrast as underlying price strength partly masked by the customary post-summer slowdown. Seattle, meanwhile, recorded an annual decline of 2 percent.
The durability of builders’ sales strategies now faces pressure from financing costs and weak buyer traffic. Freddie Mac put the average 30-year fixed mortgage rate at 7. 22, compared with 6. Kushi said elevated supply continued to give buyers negotiating room and keep pressure on builders to remain competitive. Although price adjustments, incentives and less expensive homes had supported transactions, she warned that sustaining sales could require further concessions with mortgage rates above 7 percent and traffic at a multi-year low.