Precious metals · Markets
Gold falls $87 to $4,095 an ounce
Gold traded at $4,095 per ounce at 9 a.m. Eastern on October 14, 2026, below both its day-earlier and year-earlier levels despite a broader advance since the beginning of 2025.
By Sera Wyclen · 3 min read
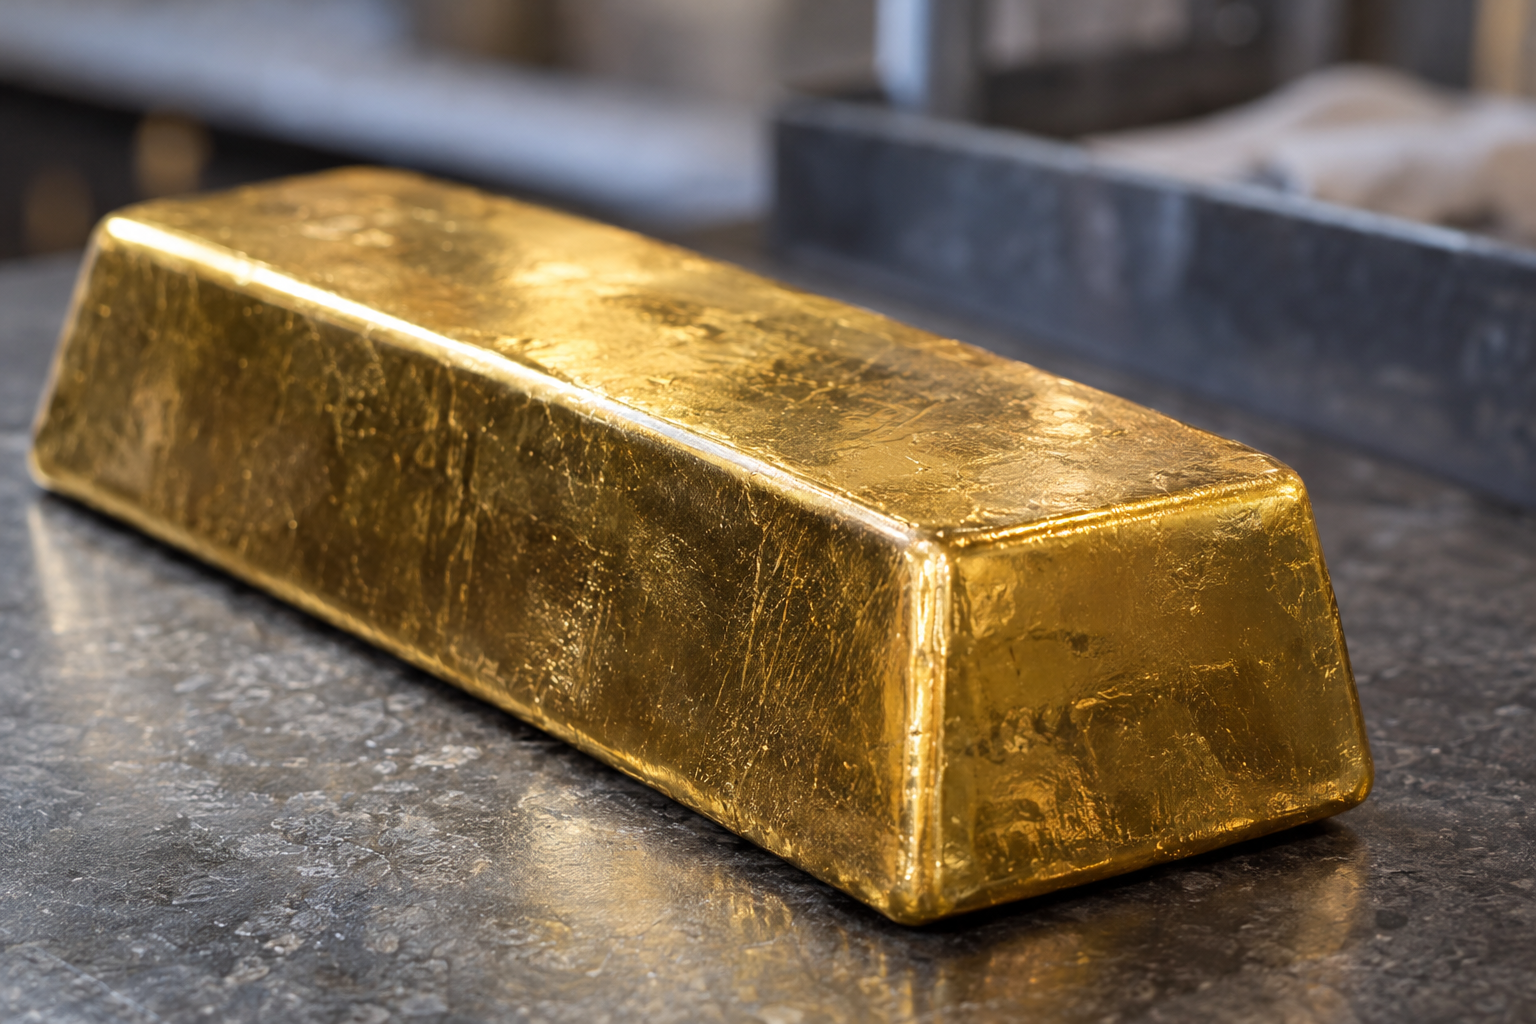
Gold stood at $4,095 per ounce at 9 a.m. Eastern on October 14, 2026, down $87 from the same time a day earlier. The latest price was below its year-earlier level as well, tempering the picture of strength suggested by the metal’s longer-term advance. It also presents investors with contrasting readings: a weaker daily price alongside gains since the beginning of 2025, against a backdrop of support for diversifying with gold during uncertain market conditions.
The key comparisons cover different periods and should be read separately. Along with the $87 daily decline, the price was more than $14 below its level a year earlier. Over the longer period beginning in 2025, however, gold prices were up over 25%. Those figures describe neither an uninterrupted climb nor a decline across every timeframe. Rather, they show how the assessment of gold’s performance changes with the starting point used to measure it.
The backdrop to the longer advance has been inflation and uncertainty, which have helped propel gold prices to record highs. That context helps explain why the broader account of gold’s strength can coexist with a daily fall. The latest quotation does not erase the gain measured from the beginning of 2025. Equally, that broader gain does not alter the fact that the October 14 reading was lower than the reference prices for both the previous day and the previous year.
Read more: Nasdaq drops nearly 2% as inflation rattles stocks
The timing of the quotation is also central to what the figures establish. The $4,095 price is a reading taken at 9 a.m. Eastern, rather than a statement about where gold finished the day. Its $87 decline is measured against the same time the previous day, making the comparison specific to those observations. It does not, by itself, describe the path prices followed between them or establish whether the weakness continued after the morning reading.
The annual comparison offers another qualification to the longer-term picture. Gold was more than $14 lower than a year earlier, but the supplied figures do not give a precise amount for that decline beyond the stated threshold. They therefore support a clear conclusion about direction, not an exact annual change. Placed beside the gain of over 25% since the beginning of 2025, the annual reading illustrates why a strong extended advance need not translate into a positive result over every shorter period.
The supportive investment view centres on diversification. Many experts suggest this is a good time to diversify with gold, a recommendation presented alongside the account of inflation and uncertainty. That recommendation is not framed as a response to a rise in the latest daily price. The argument instead places gold within a broader investment mix. That is a different proposition from forecasting an immediate recovery, and the available material provides no price target or timetable for a renewed move higher.
Read more: IMF warns Saudi attacks could have worldwide consequences
A more cautious reading starts with the observed declines. The morning price was below both the previous day’s and the previous year’s reference points, so the longer-term record alone cannot establish that a new investment would gain value. The daily fall also qualifies any description of gold as steady: in this instance, its quoted value fell $87 between the two morning observations. The figures support a distinction between an argument for diversification and a claim that prices will remain stable.
Neither interpretation supplies a specific explanation for the $87 move. Inflation and uncertainty are identified as forces behind the broader rise, but that does not establish what caused this particular daily decline. Assigning the fall to a new development would go beyond the information available. For now, the clearest account is numerical: a lower morning quotation, a negative year-earlier comparison and a substantial gain when measured from the beginning of 2025.
For investors considering the diversification argument, the different timeframes therefore provide context that a single description of the market would miss. Emphasising only the record highs would leave out the latest weakness; focusing exclusively on the daily decline would omit the longer advance. The available evidence accommodates both. It presents gold as an asset that has benefited from inflation and uncertainty while still recording declines over the specific daily and annual comparisons supplied with the October 14 price.
The next question is whether subsequent prices extend the decline or restore some of the lost ground. The morning snapshot cannot answer that, and the supplied outlook offers no forecast for the next trading period. What it does establish is the immediate benchmark: $4,095 an ounce at 9 a.m. Eastern, down $87 from the same time a day earlier. Any assessment of what follows will need to distinguish that short-term movement from the separate case for diversification and the longer rise since the beginning of 2025.